Summary
Fund-management analyst Nick Crease recently ranked 12 popular UK dividend stocks, judging them on dividends, coverage, growth, valuation, risk and the macro environment. Our screener scores the same companies mechanically, on four factors that barely look at dividends at all. The result: a rank correlation of 0.65 across all twelve, with our top two both sitting in his top two tiers and both systems putting the same company emphatically last. But the agreement isn't spread evenly — it is almost entirely a shared view of risk, while our value factor runs actively against him. This piece walks through both methodologies, where they agree, and what the disagreement says about the limits of each approach.
The experiment
Last night I was browsing YouTube and I came across Nick, who was talking about his method for assessing companies. He went through several large, well-known UK stocks and put them in a rank order. I was then intrigued to find out how my own mechanical ranking system measured up against his judgment-driven human process.
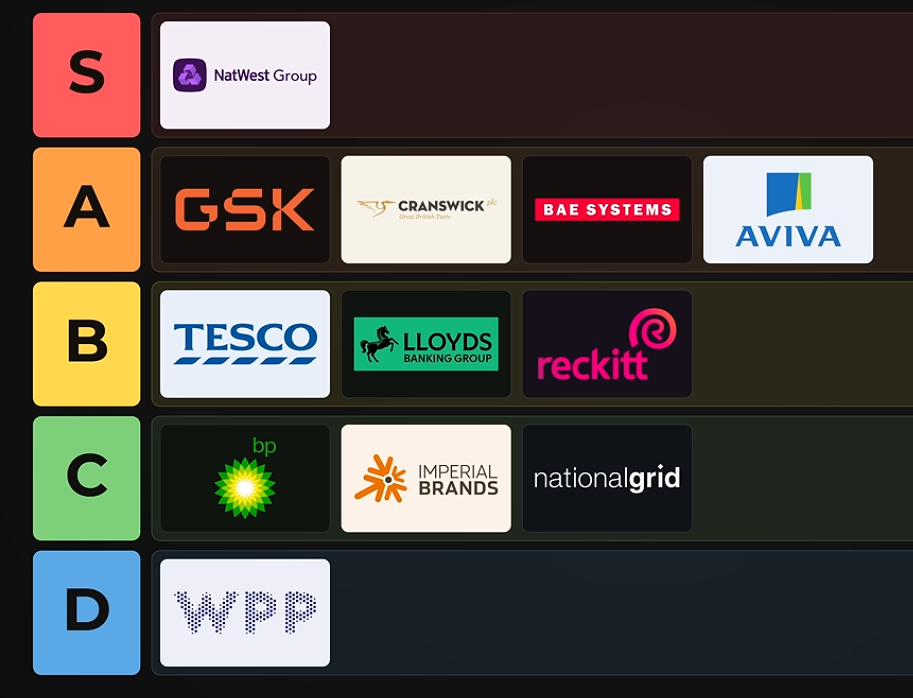
Drawing on ten years as an analyst in asset management, Nick ranked twelve of the UK's most popular dividend payers into a ranked list, from S ("best of the best" — the tier-list convention for a grade above even A) down to D. His full ranking:
S — NatWest · A — GSK, Aviva, Cranswick, BAE Systems · B — Tesco, Lloyds, Reckitt · C — BP, Imperial Brands, National Grid · D — WPP
Our screener creates scores for all of these daily, and we use a temporary composite system to collapse several measurements into a single score. The four separate scores (momentum, quality, value and risk) are meant to be read independently, as each one tells you something intrinsically different about the company. They were never meant to be combined into a single score, but for this experiment we just took a simple average.
Nick's method: six lenses and a judgment
Nick assesses each company from the perspective of a long-term holder who wants a reliable, sustainable dividend, across six areas: revenue growth; profitability and free cash flow; valuation against sector peers; risk (debt, litigation, regulation, industry decline); dividend yield and sustainability — payout ratios, coverage, and the track record of increases; and the current macro environment. The output is a considered judgment, not a strict formula: he'll note, for example, that BP's payout ratio (158%) has been distorted by a recent write-down. Or that an insurer's earnings are marked to market, and adjust accordingly.
That ability to adjust perspective matters. A human analyst can read the data and look through data points to assess the true picture. A scoring system has to be built carefully enough to capture signal but not be overly interpretive.
Our method: four factors, no dividend history
The screener condenses each company into four scores, computed daily across roughly 700 UK-listed companies (full explanation here):
- Momentum (1–10) — twelve-month share price performance excluding the most recent three months, scaled by volatility and ranked against the whole universe.
- Quality (0–10) — ten tests of the level and consistency of returns and margins (ROE, ROIC, ROCE, gross/operating/cash margins) against sector peers. Tests that are meaningless for a business model — a bank has no gross margin — are imputed neutrally rather than failed.
- Value (0–10) — cheapness averaged across up to six lenses: forward P/E, price-to-book, price-to-sales, free-cash-flow yield, dividend yield, and growth-adjusted PEGY. At least three lenses must exist to score at all, so no stock looks cheap on one flattering ratio.
- Risk (1–10, higher = riskier) — sector-aware balance-sheet and volatility models: banks, insurers, trusts and asset-heavy businesses each get a model suited to how their balance sheets actually work.
Note what's absent from our list compared to Nick's. One of our six value lenses is the current dividend yield, so dividends aren't quite invisible to us — but nothing anywhere looks at the payout ratio, the cover, or the record of increases. So on the subject of dividends, which his tier list is built around, our scores have almost nothing to say.
To get a single rankable number for this comparison, we built a simple composite: average the four scores with risk inverted, i.e. (Momentum + Quality + Value + (10 − Risk)) ÷ 4. The screener itself deliberately doesn't publish a combined score — the factors are meant to be read together as independent values, and how you weight them is a style choice.
The results
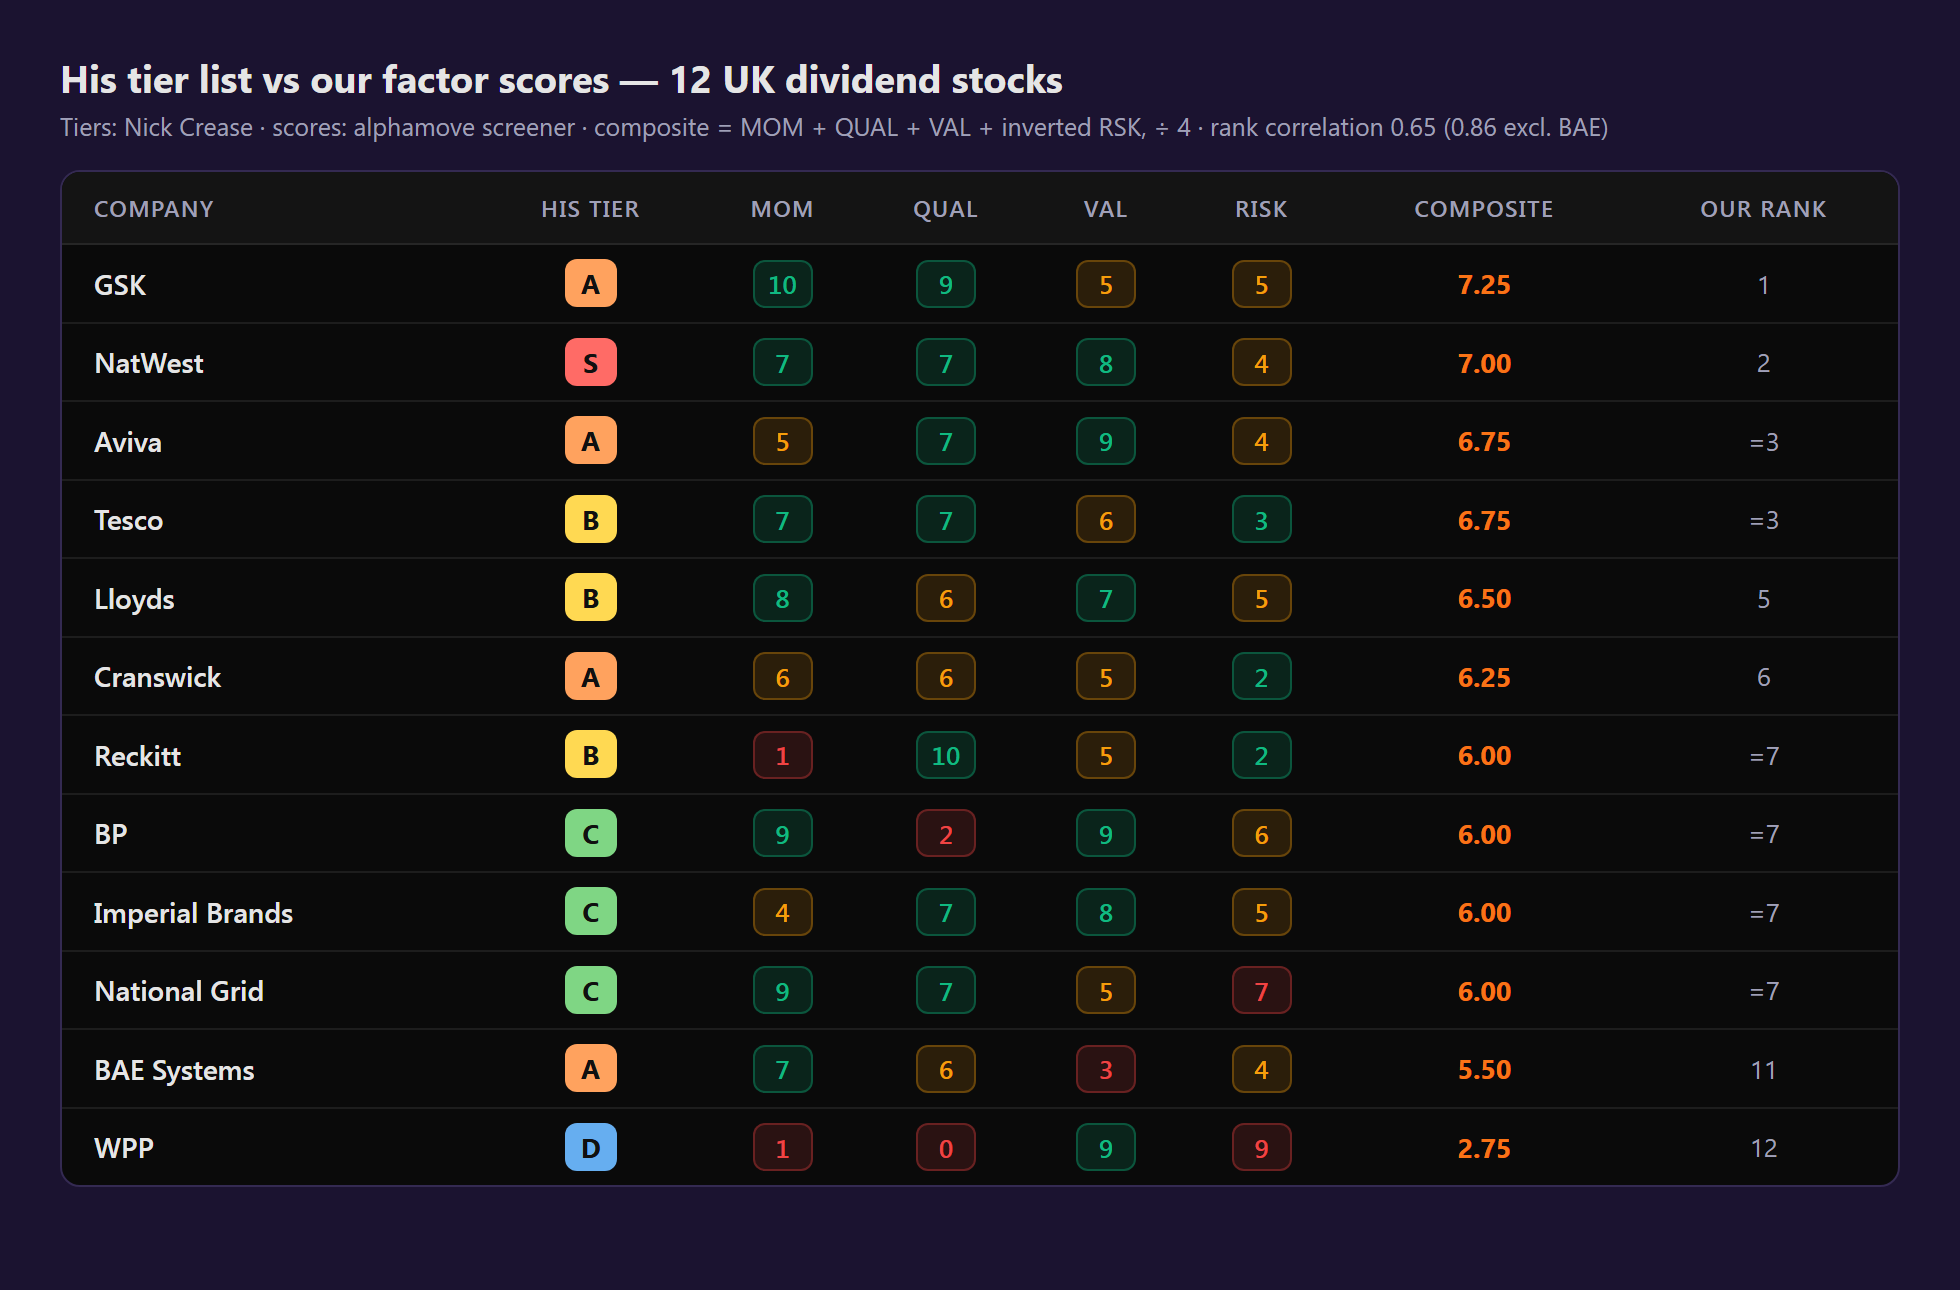
Scores as at 27 July 2026. The screener recomputes them daily, so the live values will have drifted by the time you read this.
| Company | Nick's Tier | Our Momentum | Our Quality | Our Value | Our Risk | Our Composite | Our Rank |
|---|---|---|---|---|---|---|---|
| GSK | A | 10 | 9 | 5 | 5 | 7.25 | 1 |
| NatWest | S | 7 | 7 | 8 | 4 | 7.00 | 2 |
| Aviva | A | 5 | 7 | 9 | 4 | 6.75 | =3 |
| Tesco | B | 7 | 7 | 6 | 3 | 6.75 | =3 |
| Lloyds | B | 8 | 6 | 7 | 5 | 6.50 | 5 |
| Cranswick | A | 6 | 6 | 5 | 2 | 6.25 | 6 |
| Reckitt | B | 1 | 10 | 5 | 2 | 6.00 | =7 |
| BP | C | 9 | 2 | 9 | 6 | 6.00 | =7 |
| Imperial Brands | C | 4 | 7 | 8 | 5 | 6.00 | =7 |
| National Grid | C | 9 | 7 | 5 | 7 | 6.00 | =7 |
| BAE Systems | A | 7 | 6 | 3 | 4 | 5.50 | 11 |
| WPP | D | 1 | 0 | 9 | 9 | 2.75 | 12 |
Note the ties: four companies share a composite of 6.00 and two more share 6.75, so those are genuinely equal placings rather than an ordering. All correlations below use mid-ranks for tied scores.
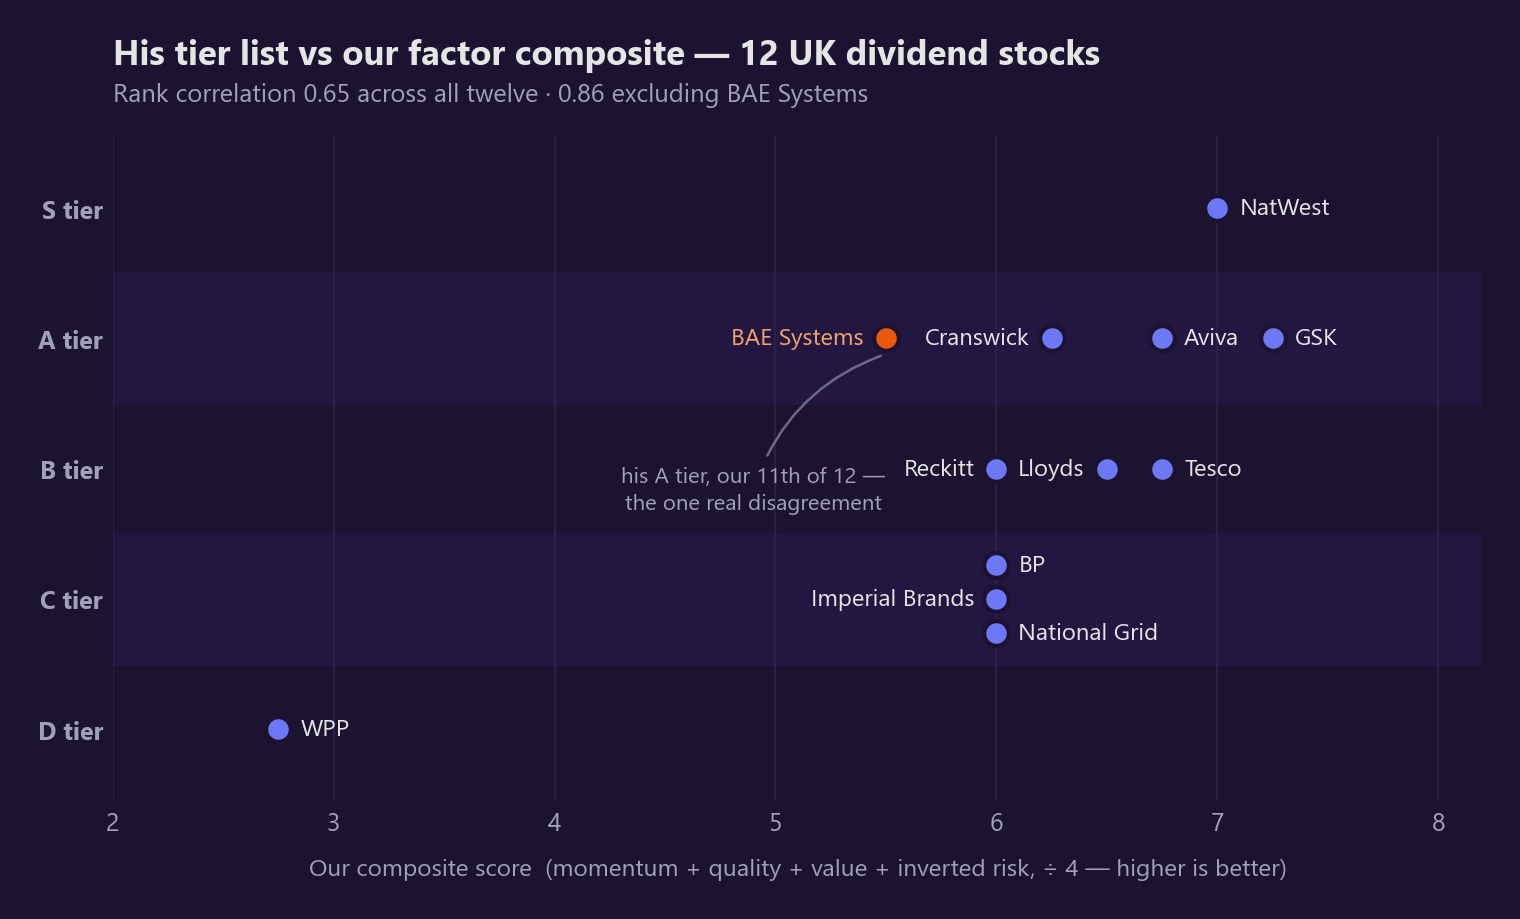
The Spearman rank correlation between his tiers and our composite is 0.65 across all twelve names. That clears conventional significance (p ≈ 0.02), but with only twelve companies the 95% confidence intervals are large (0.12 to 0.89) — this can be read as "these two processes are clearly related", but not as a precisely measured quantity. Setting aside BAE Systems, the one name they genuinely disagree about, it rises to 0.86.
What the agreement is actually made of
The headline number hides something more interesting. Run each factor against Nick's tiers on its own:
| Factor, on its own, vs his tiers | Spearman |
|---|---|
| Risk (inverted) | 0.64 |
| Quality | 0.34 |
| Momentum | 0.16 |
| Value | −0.34 |
| All four, equally weighted | 0.65 |
The composite barely improves on risk by itself. Nearly all of the agreement between a ten-year asset-management analyst and a mechanical screen is a shared view of what is risky — leverage, balance-sheet strength, volatility. That is the part of investing where two entirely different processes converge on the same answer, and it's the part our screener is doing the most useful work on.
Value, meanwhile, doesn't just fail to help — it pulls the other way. Across these twelve names, the cheaper our screen says a company is, the lower Nick tends to tier it. That isn't noise from a single stock; it's a consistent difference in philosophy visible across the whole list. He is systematically willing to pay up for a business he rates. BAE Systems is simply where that difference shows up to the largest degree.
So we could sum up: the two systems agree about risk but disagree about price.
Where the stories match — in detail
Where the systems agree, they agree for the same reasons — which the correlation alone doesn't show you.
WPP is the cleanest example. Nick's line was that the 5.4% yield "looks amazing until you know where it came from" — a collapsed share price, falling sales and a dividend already cut in half. Our score shape says precisely that in numbers: Value 9 (looks cheap), Quality 0, Momentum 1, Risk 9. That pattern — screaming cheap, everything else on the floor is the textbook value-trap signature. Both systems put WPP dead last by a wide margin.
His entire C tier lands in the four-way tie at our composite score of 6.00, sharing it with Reckitt from his B tier. These are his "flawed but not broken" names, and the flaws he describes are exactly where our scores start to reveal company weaknesses.
- National Grid: his concern is the £45bn debt pile refinancing at today's rates. Our asset-heavy risk model — knowing nothing of his view — gives it a risk score of 7/10, the second-riskiest of the twelve, even while momentum is a 9.
- BP: his worries are debt, a buyback already sacrificed to it, and oil price volatility. Ours shows Quality 2 — the worst quality score of anything he placed above D — alongside elevated risk.
- Imperial Brands: solid current numbers, existential industry question. Our scores capture the first (Quality 7, Value 8) and, honestly, not the second — more on that below.
Reckitt: Nick likes the coverage and the valuation but distrusts the stalled growth and the baby-formula litigation. Our scores hold the same argument with themselves: Quality 10, Momentum 1.
The disagreement: what is quality worth?
BAE Systems is where the value disagreement plays out — his A tier, our second-from-bottom. The cause is transparent: it is expensive on every lens our Value score looks at. A trailing P/E of 29, a forward P/E near 24, price-to-book of 5, a 1.8% yield and a PEGY above 2 leave it with a Value score of 3.
Nick justifies the price: "you're paying a premium for a fairly small income, but the quality of the business is hard to argue with." He sees the same expensiveness our Value score sees. He just decides the £83bn order book and rising European defence budgets make a difference to his assessment. That's not a measurement disagreement — it's a philosophy difference about whether quality is worth paying that bit extra for.
This is also the practical lesson of the negatively correlated value score −0.34. Nick is just willing to pay up for quality; he's not hunting bargains.
What he sees that we don't: the macro
Nick's sixth criterion is the current macro environment, and it does real work in his tiers. NatWest's S grade rests partly on a backdrop of higher-for-longer interest rates and strong UK household deposits; Aviva gets credit because higher rates make annuities more profitable; National Grid is marked down partly because its debt reprices in that same environment.
Our system has no macro input at all — but it imports one second-hand. A rate environment that's good for UK banks shows up as UK bank share prices trending, and NatWest's Momentum 7 and Lloyds' 8 are exactly that tailwind, already priced in. His macro view is explicit and forward-looking; ours is implicit and backward-looking, appearing through twelve months of price action. When the regime turns, he can re-tier the next day — our momentum score would take months to notice. Structural decline that hasn't reached the accounts yet is precisely what mechanical scoring misses, and why a screen is where analysis starts, not where it ends.
Conclusion
Twelve stocks is a small sample, hand-picked for dividend popularity rather than randomly, and the confidence interval around 0.65 is so wide it tells us that there is a relationship, but it's loose. His tiers answer "is this a reliable long-term dividend hold?"Our scores answer the broader "how does this company measure up right now?". And nothing here is a recommendation to buy or sell anything.
With all that said: a ten-year asset-management analyst weighing dividends, coverage and macro judgment, and a mechanical system counting margins, balance sheets and price trends, looked at the same twelve companies and produced a similar order — our top two names both sit in his top two tiers, the same name is emphatically last, and the middle largely lines up. More usefully, the comparison shows where that agreement lives. Two independent processes converge on which companies are risky, and diverge on what quality is worth paying for. The first of those is a reassuring external check on the risk model; the second isn't a flaw in either system, it's the choice every investor has to make for themselves.
Nick can't rank 700+ stocks every day; our system hasn't got his experience or his global view. They're doing different jobs, and the comparison hasn't made me want to trade one for the other. What it has given me is a map of where the mechanical version can be trusted — reliable about risk, opinionated about price, blind to whatever hasn't reached the accounts yet. Knowing that is what turns four numbers into a first filter worth considering, and it's why the screen is still where I start before I read a single annual report. It's not right about everything but reliably right about something, and honest about the rest.
Disclosure: I hold no personal position in any of the companies mentioned. Lloyds, NatWest and BAE Systems are held by an investment club of which I am a member.
Try the screener on all 700+ UK-listed companies
Video: Ranking 12 Popular UK Dividend Stocks: Which Are Worth Owning?